[0]
252=200

[1]
248=200

[2]
250=200

[3]
251=200

[4]
250=200

[5]
250=200

...You can use this guide to understand how to properly execute load tests, what data to collect during load tests and how to interpret that data.
(Editor’s note: At ~3500 words, you probably don’t want to try reading this on a mobile device. Bookmark it and come back later.)
Introduction
Have you ever built a new web application, and shortly before launch your boss burst in with one of those dreaded questions:
-
Will your web app scale?
-
Can you handle 10000 simultaneous users?
-
What if you’re going to become the next Amazon?
Even worse, then you’ll open up AWS’s EC2 instance type page, and you are bombarded with hundred different instance types, ranging from A1 to z1d. Which one to take for your next Amazon?
Load-Testing will help you form an answer. But, interestingly, there is very little information out there on how to sensibly approach the questions mentioned above, apart from running a couple of random JMeter tests to tick off some launch-list check boxes.
So, rephrasing your boss’s question: How do you find out if your web app will scale?
You’ll learn a process to find an answer to that question in the remainder of this document.
How to load test
Infrastructure Setup
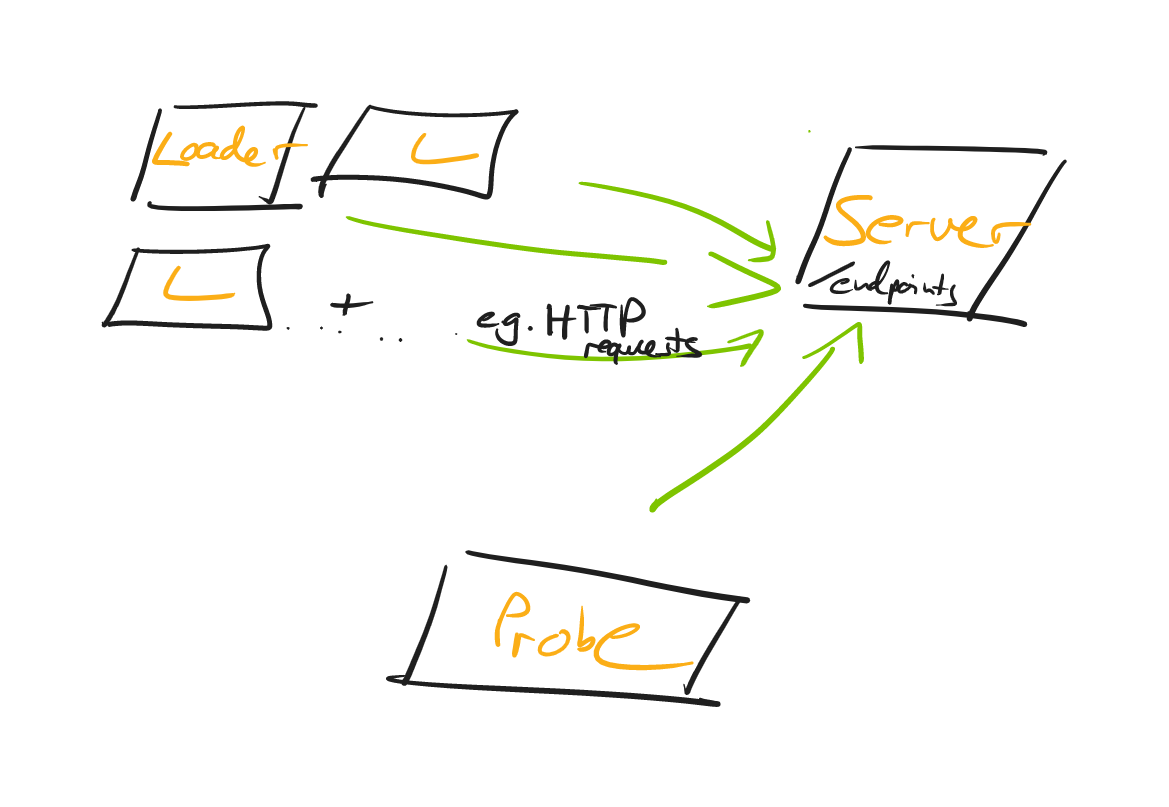
Independently of your programming language ecosystem (PHP, Ruby, Java, or something entirely different), you should end up with a load testing setup, that looks roughly like this:

Let’s have a closer look at the individual parts.
Server
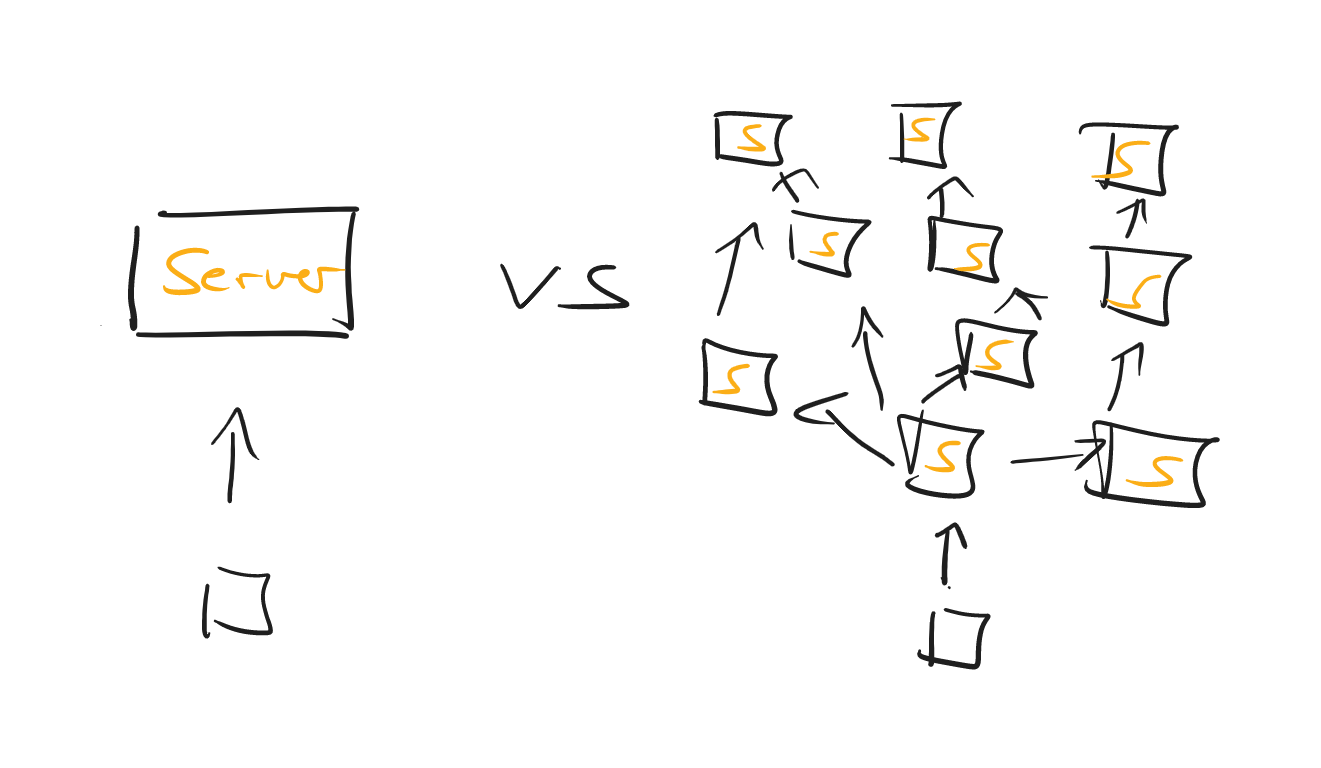
The server, well, runs the web application that you want to load test. You don’t have to think of it as just a single server, in fact, this can range from a tiny web server, a web server + a database, to a whole microservice landscape - more on that in a bit.
Loader
A common shortcut is to generate the load on the same machine (i.e. the developer’s laptop), that the server is running on.
What’s problematic about that? Generating load needs CPU/Memory/Network Traffic/IO and that will naturally skew your test results, as to what capacity your server can handle requests.
Hence, you’ll want to introduce the concept of a loader: A loader is nothing more than a machine that runs e.g. an HTTP Client that fires off requests against your server.
A loader sends n-RPS (requests per second) and, of course, you’ll be able to adjust the number across test runs. You can start with a single loader for your load tests, but once that loader struggles to generate the load, you’ll want to have multiple loaders. (Like 3 in the graphic above, though there is nothing magical about 3, it could be 2, it could be 50).
It’s also important that the loader generates those requests at a constant rate, best done asynchronously, so that response processing doesn’t get in the way of sending out new requests. Check out https://github.com/jetty-project/jetty-load-generator for such a load generator.
Bonus points if the loaders aren’t on the same physical machine, i.e. not just adjacent VMs, all sharing the same underlying hardware. Read this article on problems with co-located VMs.
Last but not least, you can split responsibilities even more, by not letting your loaders record latencies (e.g. response ms), instead you’ll use a probe for that.
Probe
A probe is a machine that represents, essentially, a single user.
It does not go crazy with generating load, Instead it slowly, but surely, fires off maybe 1-2 RPS and, while doing so, records the latencies that you’ll later on evaluate.
Do note, that there are differing opinions on splitting loaders and probes, but it’s the approach I’m going within this guide. If you made different experiences, do leave a comment in the comment section!
Concepts
Starting Small
The biggest mistake you can make is to fire off your initial load test against your whole microservice universe - unless you have internalized the process that is yet to follow in this guide.

So, a sensible approach would be to:
-
Start load testing a single unit of your entire (distributed) system.
-
Once you feel comfortable evaluating the test data for that one system, make the load test encompass more and more services.
-
Pat yourself on the back once you’re testing the entire system.
Along the way, do try and note who the weakest link in your chain of services might be. It doesn’t help to auto-scale your EC2 web servers into oblivion if your t2.micro database can only handle 3 SQL statements at any given time.

User Journeys
A lot of benchmarks posted online of services and scale are of the synthetic kind: Look, I have this reactive web service and it handles 1.000.000 requests/second.
That’s all nice and dandy, but doesn’t help us when doing real-life load testing.
Unless you’re building a 1-REST-method-service, you’ll need to think of the most important scenarios and workflows your users are going through. For an e-commerce system, that would be browsing product pages and using checkout, including all the backend processing - not just endlessly calling the password-reset REST API.
If you have historical data to use (aka where my users spend most of their time on), great, use it. If not, take an educated guess and adapt as soon as you can.
There is an exception to the rule of "real-life user-journeys", however. As long as you’re still uncomfortable with recording and evaluating the data (from recording and interpreting latencies, flame graphs, and GC logs), try out the load-testing process with a toy example, which only has one REST method and serves bogus JSON data.
Duration
How long should your load-tests run for? 5 seconds? 60 minutes? Exactly 42,75 seconds?
Frankly, there are a plethora of opinions out on the web on what the perfect timespan is. You can start with this rule of thumb:
-
If you’re using a platform like the JVM, you’ll want to include a warm-up period in your load tests, which could be anywhere between 20-60 seconds. During which you don’t record any latency data etc.
-
Run the actual load test for 1-5 minutes. (great numbers, huh?)
What’s more important than having very specific durations, is to repeat your test runs, and cross-check the results across those runs. If you start getting entirely different results with (almost) the same parameters, that’s a reason to investigate.
Verify Test Runs
Another important point is not just to take a look at your recorded latencies. Instead, you need to verify each load test run.
What does that mean? You’ll need to find an answer to the following questions:
-
Was my server overloaded, in terms of CPU/memory/IO?
-
Was any of my loaders overloaded, in terms of CPU/Memory/IO?
-
Were there any API problems, 400s or 500s?
If you answer yes to any of these questions, ignore your test results.
-
If the server is the bottleneck then you are limit testing (when does my server break down!!), not load testing.
-
If one or all of the loaders are the bottleneck, you need more loaders or scale them up individually.
-
If there are API problems, well, you’ll need to talk to your devs.
The hard part about this is having the consistency and discipline of validating all the data for every. single. test. run and not just jumping to conclusions because a load test finished and you see a graph printed out somewhere.
To verify the data, we need to first collect the data. Let’s see in the next section, what data specifically, how you can do that, and in what output format you’d generally like to see the data.
What data to record during a load test
Basic Load Testing Data
At a minimum, you should record the data in the following sections.
This doesn’t mean you immediately have to dive into complex tools, monitoring solutions and dashboards like Azure’s App Insights, Prometheus and Kibana.
Instead, you can start by writing a couple of lines of code that record e.g. your REST clients' response times and convert those to a HdrHistogram. To see the corresponding code for all the graphs & diagrams in this article, check out PerformanceTest.java in my repo and the Jetty Perf Project.
Latencies
You’ll want your probe to record its request-response times for every test run and then figure out how the latencies changed across runs, once you start cranking up the load.
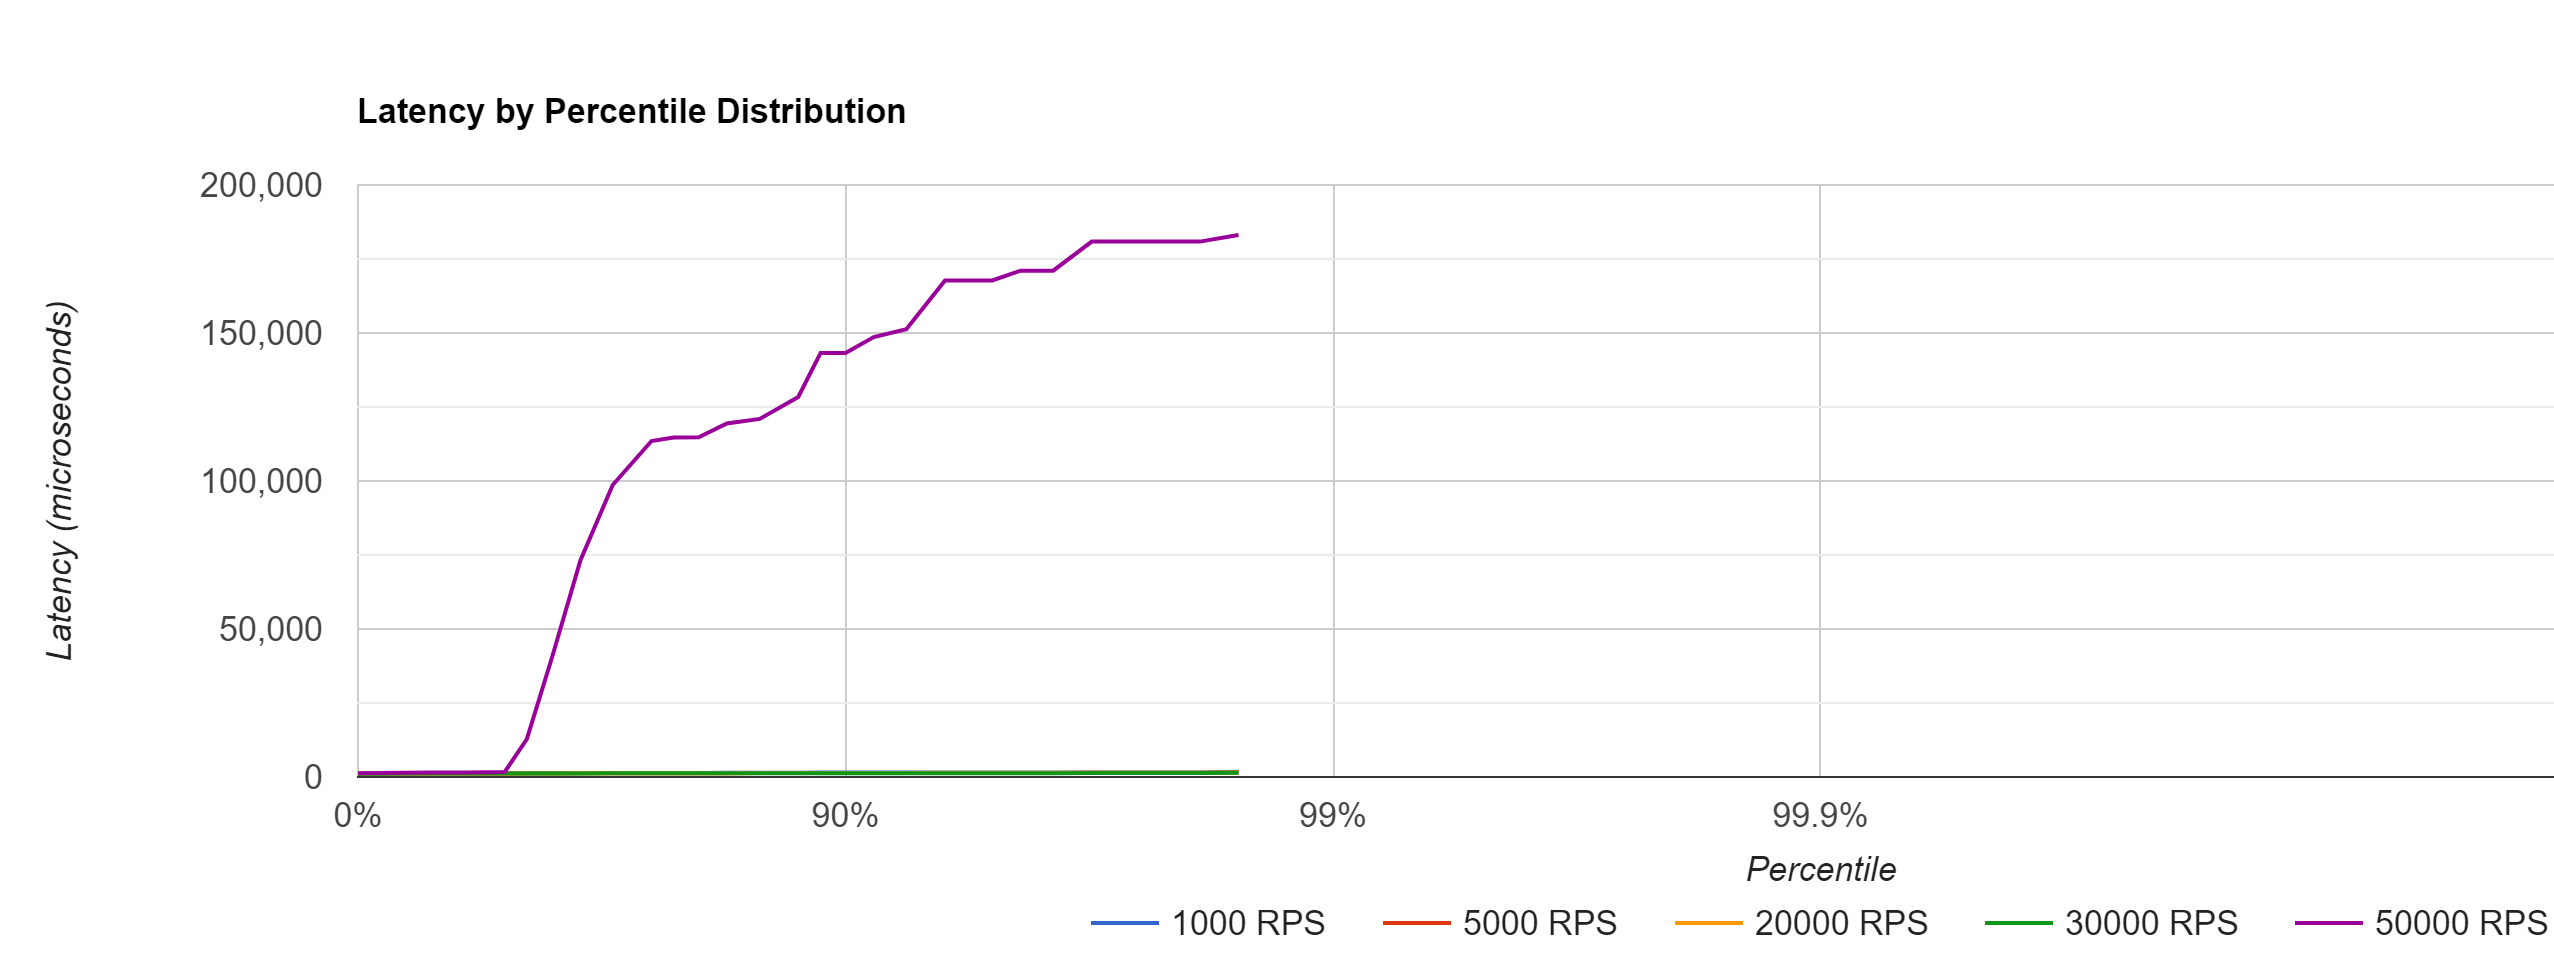
For that, it makes sense to not just record raw data (e.g. calling the /tax_rate endpoint of my REST application took [50ms, 51ms, 37ms, 49ms, …, etc]), but to visualize those response rates in a High Dynamic Range Histogram.
Here’s a histogram that shows the probe’s latencies across multiple (in microseconds, divide by 1000 to get ms) load test runs, where loaders hammered the server from 1000 RPS → 50000 RPS.

The histogram, with just a single glance, will give you a quick idea of what your response time percentiles (90%, 99% etc..) look like and also how those response times change, with varying loads.
Throughput
You’ll also want to have a general overview of the throughput of both, your loaders and your server and again, visualize the raw data in a line chart.
If you tell your loaders to send 4000 requests per second to the server, the throughput (i.e. sending those 4000 requests every second ) should, in fact, be 4000 requests per second, and not just 2314 requests. Which will result in a pretty constant line chart like seen below.

If that chart doesn’t look level, it means your loaders had issues generating that many requests and you must reduce the load and possibly spawn new ones.
Similarly, if your loaders are doing just fine, but your servers throughput chart looks like this:

You immediately know that your server has issues responding to that many requests, is definitely at its limit in one regard or another and you’ll need to cross-check with all the CPU/memory/application data below to find out what the culprit is.
HTTP Status Codes
This sounds so simple, but if forgotten leads to wrong conclusions. For every HTTP request that is sent during your load test, you should record its HTTP response status code. Was it all 200s? Good.
Were there bad requests (400s), because an API changed, or maybe even server errors (500s), because a pesky bug entered the backend? Then you’ll need to throw away your test results and re-run the test.
Above you’ll see a custom text format (taken from the Jetty Perf Project), that’ll quickly display all the status codes of all HTTP requests that were issued in a specific second of the test.
This is how you read those lines, e.g.
[0]
252=200-
[0]: The first second of the load test
-
252: Number of HTTP requests that were sent
-
200: Came back with Status Code 200
OS Metrics: Big Picture
To find out if any of your participants (loaders, servers, probe) behaved or maybe were overloaded during your test run, you’ll need to record operating system metrics for.every.single.participant of the test.
CPU
This will depend on your operating system, but if you are e.g. using Linux machines, you can gather data on your CPU in specific intervals with the mpstat command (5s intervals in this case)
mpstat -P ALL 5Assuming this command ran for 15 seconds (3 intervals a 5s) on a machine with 4 CPUs, you’d get output like this:
08:39:46     CPU    %usr   %nice    %sys %iowait    %irq   %soft  %steal  %guest  %gnice   %idle
08:39:46     all    9.15    0.00    7.31    0.01    0.00    1.22    0.00    0.00    0.00   82.31
08:39:46       0   12.64    0.00    8.95    0.00    0.00    0.99    0.00    0.00    0.00   77.42
08:39:46       1    5.25    0.00    3.87    0.00    0.00    5.99    0.00    0.00    0.00   84.90
08:39:46       2    7.70    0.00    6.70    0.00    0.00    0.00    0.00    0.00    0.00   85.60
08:39:46       3    7.77    0.00    6.68    0.00    0.00    0.09    0.00    0.00    0.00   85.46


08:39:56     CPU    %usr   %nice    %sys %iowait    %irq   %soft  %steal  %guest  %gnice   %idle
08:39:56     all    7.66    0.00    6.57    0.00    0.00    0.64    0.00    0.00    0.00   85.12
08:39:56       0   11.24    0.00    8.47    0.00    0.00    0.25    0.00    0.00    0.00   80.03
08:39:56       1    4.27    0.00    4.65    0.00    0.00    3.42    0.00    0.00    0.00   87.67
08:39:56       2    5.40    0.00    5.12    0.00    0.00    0.00    0.00    0.00    0.00   89.48
08:39:56       3    9.23    0.00    8.46    0.00    0.00    0.09    0.00    0.00    0.00   82.23


08:40:06     CPU    %usr   %nice    %sys %iowait    %irq   %soft  %steal  %guest  %gnice   %idle
08:40:06     all    7.51    0.00    6.12    0.00    0.00    0.71    0.01    0.00    0.00   85.65
08:40:06       0    8.90    0.00    6.32    0.00    0.00    0.27    0.09    0.00    0.00   84.43
08:40:06       1    7.60    0.00    5.65    0.00    0.00    3.00    0.00    0.00    0.00   83.75
08:40:06       2    5.60    0.00    5.60    0.00    0.00    0.00    0.00    0.00    0.00   88.80
08:40:06       3    9.26    0.00    7.95    0.00    0.00    0.09    0.00    0.00    0.00   82.71
Every table above corresponds to a CPU load snapshot, either across all CPUs (averaged), or the individual CPUs (0,1,2,3 = 4 CPUs).
08:39:46     CPU    %usr   %nice    %sys %iowait    %irq   %soft  %steal  %guest  %gnice   %idle
08:39:46     all    9.15    0.00    7.31    0.01    0.00    1.22    0.00    0.00    0.00   82.31
08:39:46       0   12.64    0.00    8.95    0.00    0.00    0.99    0.00    0.00    0.00   77.42
08:39:46       1    5.25    0.00    3.87    0.00    0.00    5.99    0.00    0.00    0.00   84.90
08:39:46       2    7.70    0.00    6.70    0.00    0.00    0.00    0.00    0.00    0.00   85.60
08:39:46       3    7.77    0.00    6.68    0.00    0.00    0.09    0.00    0.00    0.00   85.46
For a quick & dirty start you can simply take the inverse of the %idle column from the all line, to find out how busy your CPUs on average were during that snapshot (e.g. 100%-82.31% = 17,69%).
Though you naturally want to also have a look at individual CPU performance, especially for scenarios where only one of your CPUs was maxed out, while all others were idling.
Network
Again, depending on your operating system you’ll want to gather snapshots of your network traffic with different commands. On Linux, you could be using the sar tool for network snapshots every 5 seconds.
sar -n DEV -n EDEV 5The output will be a file like this, where two tables correspond to one snapshot.
08:39:36        IFACE   rxpck/s   txpck/s    rxkB/s    txkB/s   rxcmp/s   txcmp/s  rxmcst/s   %ifutil
08:39:46           lo     12.30     12.30      1.62      1.62      0.00      0.00      0.00      0.00
08:39:46         ens5   5006.90   5094.00   1208.58    890.41      0.00      0.00      0.00      0.00

08:39:36        IFACE   rxerr/s   txerr/s    coll/s  rxdrop/s  txdrop/s  txcarr/s  rxfram/s  rxfifo/s  txfifo/s
08:39:46           lo      0.00      0.00      0.00      0.00      0.00      0.00      0.00      0.00      0.00
08:39:46         ens5      0.00      0.00      0.00      0.00      0.00      0.00      0.00      0.00      0.00

08:39:46        IFACE   rxpck/s   txpck/s    rxkB/s    txkB/s   rxcmp/s   txcmp/s  rxmcst/s   %ifutil
08:39:56           lo      3.70      3.70      0.49      0.49      0.00      0.00      0.00      0.00
08:39:56         ens5   5003.80   5114.30   1207.87    891.30      0.00      0.00      0.00      0.00

08:39:46        IFACE   rxerr/s   txerr/s    coll/s  rxdrop/s  txdrop/s  txcarr/s  rxfram/s  rxfifo/s  txfifo/s
08:39:56           lo      0.00      0.00      0.00      0.00      0.00      0.00      0.00      0.00      0.00
08:39:56         ens5      0.00      0.00      0.00      0.00      0.00      0.00      0.00      0.00      0.00

08:39:56        IFACE   rxpck/s   txpck/s    rxkB/s    txkB/s   rxcmp/s   txcmp/s  rxmcst/s   %ifutil
08:40:06           lo      4.00      4.00      0.51      0.51      0.00      0.00      0.00      0.00
08:40:06         ens5   4928.50   5019.20   1189.49    876.60      0.00      0.00      0.00      0.00

08:39:56        IFACE   rxerr/s   txerr/s    coll/s  rxdrop/s  txdrop/s  txcarr/s  rxfram/s  rxfifo/s  txfifo/s
08:40:06           lo      0.00      0.00      0.00      0.00      0.00      0.00      0.00      0.00      0.00
08:40:06         ens5      0.00      0.00      0.00      0.00      0.00      0.00      0.00      0.00      0.00
Important are the columns rxkB/s, as well as txkB/s, which, if multiplied by 0.008, give you the megabits of data your network interfaces receives per second, as well as it sends out.
08:39:36        IFACE   rxpck/s   txpck/s    rxkB/s    txkB/s   rxcmp/s   txcmp/s  rxmcst/s   %ifutil
08:39:46           lo     12.30     12.30      1.62      1.62      0.00      0.00      0.00      0.00
08:39:46         ens5   5006.90   5094.00   1208.58    890.41      0.00      0.00      0.00      0.00
Looking at the second snapshot above that would be
-
1207.87 rxkB/s * 0,008 = 9.66 Megabit - quite a lot of room left, if you have a 100Mbit network interface.
-
891.30 txkB/s * 0.008 = 7.12 Megabit
(Do note that networks adapters are usually duplex, hence if you have a 100MBit interface, you’re not only able to do just 50Mbit/50 Mbit.)
Memory
All the concepts mentioned above for CPU and network are also valid for memory. On Linux machines, you can capture memory snapshots every 5 seconds with the free tool.
free -h -s 5You’ll receive output like this, again, each table corresponding to a specific snapshot.
              total        used        free      shared  buff/cache   available
Mem:           30Gi       504Mi        29Gi       0.0Ki       519Mi        30Gi
Swap:            0B          0B          0B

              total        used        free      shared  buff/cache   available
Mem:           30Gi       655Mi        29Gi       0.0Ki       519Mi        29Gi
Swap:            0B          0B          0B

              total        used        free      shared  buff/cache   available
Mem:           30Gi       661Mi        29Gi       0.0Ki       519Mi        29Gi
Swap:            0B          0B          0B
On a glance, you’ll see how much memory was free/used, from the total available amount.
I/O
Will be added in the next revision of the guide.
Application Metrics: Detailed Picture
Apart from big picture data, you’ll also want to be able to have a closer look at what’s going on inside of your application. For that, you can collect the following data:
Business Logic Execution Time
This depends a bit on the web server & frameworks you are using, but essentially, you’d want to collect response times for requests excluding client latency and excluding parts of the system you cannot influence, e.g. your web server’s HTTP request handling.
In short: How much execution time does your business logic take? How long does your controller need to prepare a JSON response from an SQL query?
Again, you’ll want to visualize the data in a histogram, to get a quick understanding of request latencies and percentiles, across test runs.

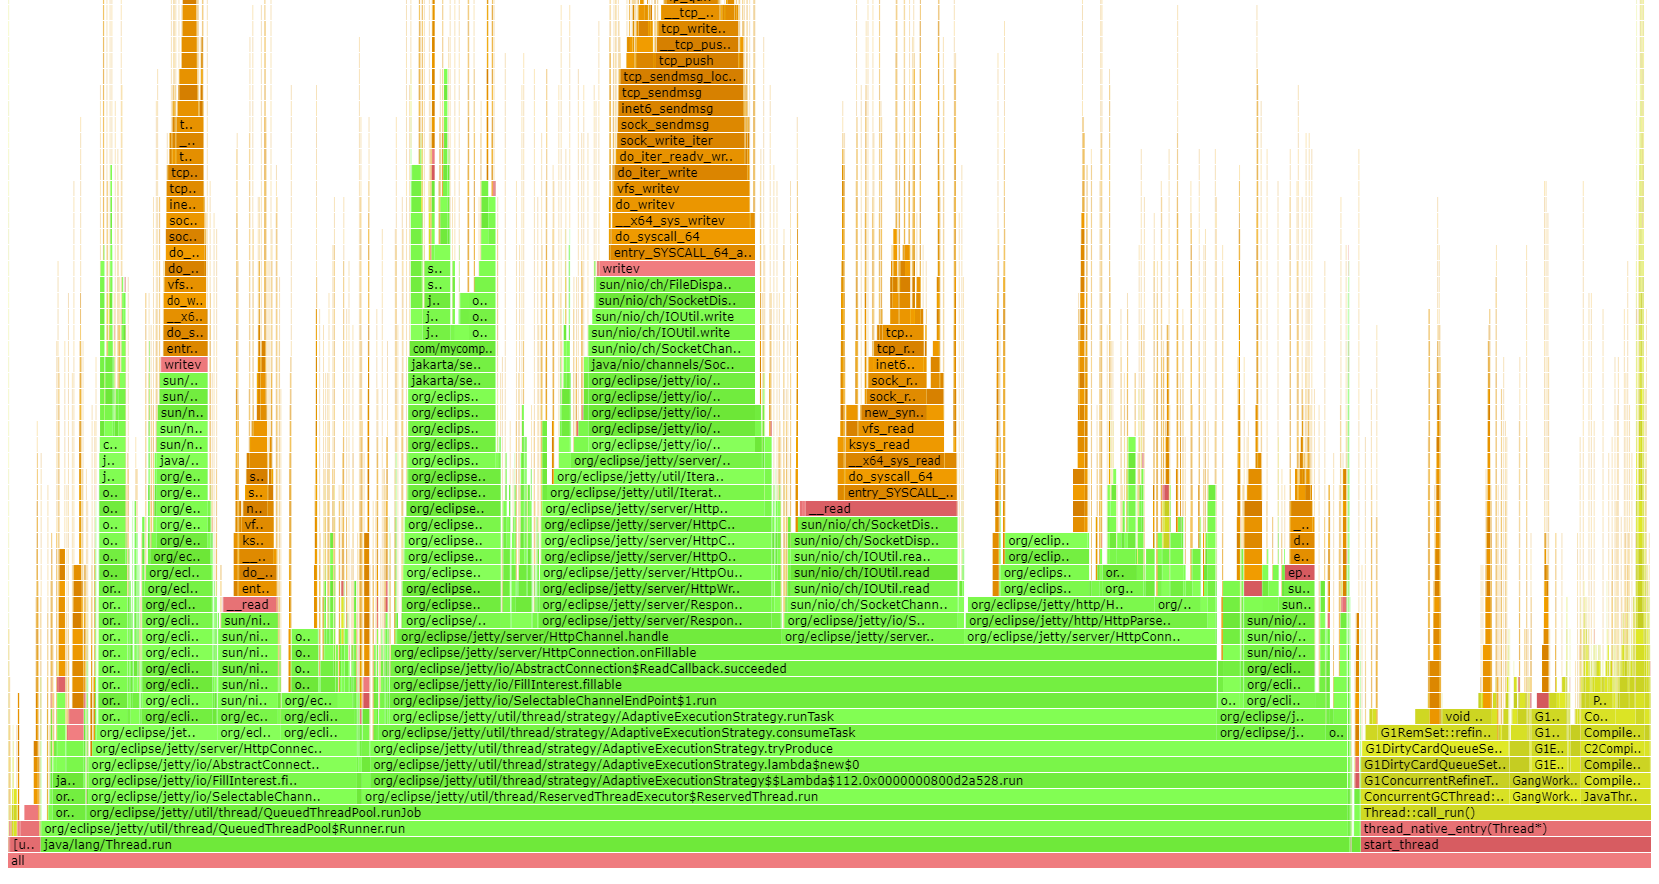
Flame Graphs: CPU/Memory
In simple terms, Flame Graphs allow you to visualize where your application, or rather its code paths, spends its CPU & memory.
The example below is a Java CPU flame graph, though you can generate them for a variety of programming ecosystems and flame graphs not only show you your application’s code paths (green color), but also where CPU/memory is spent in terms of the JVM/C++ (yellow), operating system (red) and even the kernel (orange).

To learn more about flame graphs, read this excellent page by Brendan Gregg, the inventor of flame graphs.
JHiccup / GC Collection files (JVM specific)
For garbage-collection platforms like the JVM, it also makes sense to record garbage collection logs and/or use an instrumentation tool like jHiccup, which records JVM stalls.
Graphs/Examples will be added in the next revision of the guide.
How to interpret load testing data
Now that you know what data to collect during a load test run, here’s the process you should follow in verifying if your test run was valid:
For every test run:
-
Check the big picture (CPU, Memory, I/O) of every load test participant for suspicious data: Was this machine approaching a limit/overloaded? What’s the general resource consumption trend?
-
Check the application-specific data: What are the execution times/memory consumption of your hot code paths? What about flame graphs & GC? How does the picture change across test runs?
-
Change the load. Repeat the test run. Collect & interpret the data accordingly.
Note: It helps seeing this process in action. For that, watch the video under Fin & Video . Or leave a comment with any of your questions in the comment section. I’m happy to reply :)
Real-World Load Testing
Here are some common challenges when load testing.
The curse of absolute data
Almost every performance chart, or rather the follow-up analysis, likes to focus on absolute data. Here, my web server’s single endpoint handled 10412 requests/s, how awesome is that! And it’s much better than that other stack, which only handles 10399 requests/s!
But those synthetic numbers, executing a fraction of a regular user’s workflows don’t mean anything. As mentioned in User Journeys, you’ll need to try and come up with realistic user workflows, with realistic infrastructure scenarios, and especially, realistic load, NOT limit test scenarios.
Managing Expectations
A lot of load testing scenarios are based on incredibly high, and thus unrealistic, load numbers. Be that because of wishful thinking (we’re going to be the next Amazon, NEXT MONTH!), or an overly well-intended buffer, e.g. a regular photo upload is 4MB, but what if all our users suddenly upload 100MB photos?
Unless you have historical data (or really good reasons) available which shows that e.g. Black Friday’s draw in 10x the normal traffic, your site or app will not experience overnight exponential growth.
Instead, you’ll need to come up with realistic numbers, which could well be in the range of XX- request per minute, definitely not in the XXXXX- requests per second range, unless you are Alipay. Have a look at the StackExchange performance numbers to sooth you: https://stackexchange.com/performance .
Limit vs Load Testing
This brings us to the last point: Never confuse load testing with limit testing:
-
Load Testing: What regular load can my server handle without being constantly close to crumbling?
-
Limit Testing: What is the magic number that will finally make my server crumble?
Answering: What Instance Type To Get?
A pragmatic answer to the question at the very beginning is to get the cheapest and smallest instance type, that can handle your expected load, including a bit of buffer (i.e. you don’t want the instance running at 90% CPU all the time) - plus, you’ll be surprised what kind of load a small instance can handle.
This means you get even more practice collecting and interpreting load-test data, as you’ll now need to run your load-test scenarios across different instance types as well!
Further Reading
This article is just the very beginning of the performance testing rabbit hole. Here are a couple of junctions you might want to go down next:
Let me know where you end up!
Fin & Video
If you have read this far, you should now have a pretty thorough understanding of what load testing should look like in the real world. Of course, you’ll have to adapt this article to your own companies, i.e. setup JMeter or Gatling to fetch the correct data.
Or, you can have a look at this video, where you’ll see me go through this process live (English version now available!), with the help of the fantastic jetty-load-generator. You’ll find all the source code needed for that in this GitHub repository.
Acknowledgments
This article couldn’t have been written without the endless help and knowledge of Ludovic Orban from the Jetty web server team, whom I bugged a lot while researching this article.
In fact, most ideas for this guide were based on (e.g. stolen from :) ) already existing concepts, work and code in the Jetty Perf Project - a big thank you to the entire Jetty Team! Also, a shout-out to rom Brendan Gregg, for his many performance related resources and work.
There's more where that came from
I'll send you an update when I publish new guides. Absolutely no spam, ever. Unsubscribe anytime.
Comments

let mut author = ?
I'm @MarcoBehler and I share everything I know about making awesome software through my guides, screencasts, talks and courses.
Follow me on Twitter to find out what I'm currently working on.

